“We are sorry. Our servers are under heavy load at present. Please try again in a few minutes.” We have all seen messages like this when a service is struggling to cope with the load. But how can you test how well your website will cope under load? Katie Koschland of the FT had the answer in her talk at Codemotion Amsterdam 2019.
Server overload is a nightmare for everyone. From banks to news sites and social media to eCommerce, when your servers can’t cope with the offered load you are in trouble. Sadly, incidents like that are all too common. Sometimes, they can be caused by a virtual flash crowd, for instance on Amazon Prime Day. Other times, they may be caused by a network or hardware failure. For DevOps teams, the important thing is to know when might an overload happen and, when it does, will the system fail gracefully? This is where load testing comes in.
Load testing
Load testing is almost like destruct testing your website. It is used to answer two key questions:
- What is the maximum load my website can sustain before the performance starts to suffer?
- When my servers are overloaded, how does the system react? Does it fail gracefully or just fall over completely?
Jad Meouchy defines load testing as:
It is about simulating ordinary user activity and then applying stress until it reaches failure.
So, how do you actually do load testing? Katie took us through her journey as she learned how to do load testing while on secondment to the BizOps team at the FT.
Choosing a Framework
The first thing you need to do is to choose a suitable load testing framework. Katie set herself six requirements for her choice of framework:
- As they were using Node.JS, the framework had to be available as an npm package.
- It needed to allow personalisation of the JS code.
- It had to be able to set the headers.
- Configuration should be easy (e.g. via YAML).
- Had to work with CI tools.
- Needed to provide detailed statistics.
Using these criteria, Katie chose the Artillery framework. This allowed her to write simple code like the following to set the headers:
It can also easily handle multiple scenarios using YAML as follows:
Specify the requests
Having chosen Artillery, Katie needed to decide what sort of requests to serve. The key thing was to choose requests that represent the sort of ordinary user journeys that your site will experience. As an example, she used the FT.com website. The typical user will go to the homepage. Then they skim through a few headlines before choosing a story. They click on the story and start to read through it. At the end, they decide they liked the story and so they click to share it via LinkedIn or Twitter.
Next, you have to determine the shape of the load. This needs to reflect both the normal expected variations and the overload. If you have an existing system, you can predict this quite well by looking at your data. But before production, you have to guess. As an example, Katie gave us the figures from the FT website when they announced the failure of Interserve.
Because the BizOps API was still under development, Katie chose to use four phases of traffic:
- Warm Up: 60s with 10 virtual users arriving each second
- Ramp Up: 120s with the number of users ramping up from 10-25 per second
- Cruise: 1200s with 25 virtual users per second
- Crash: 30s with 100 virtual users arriving each second
This matches the typical pattern of activity on many websites.
Getting started
Having chosen a framework, defined some test cases and decided how to ramp up the traffic, now it’s time to actually create the test. Start with the YAML configuration. The first part is the config. Here you choose things like the target of the tests, what plugins to use for metrics capture, etc. You also specify the testing phases.
Next, you have the actual scenario section. Here you specify what each fake user query will do. You can add weights to the different scenarios as well as specifying what operations will be done.
Ready to go!
Now you are finally ready to start testing. This is as simple as typing:
$artillery run script.yamlArtillery will now run the tests. Once it is done it will present you with a list of summary statistics.

Identifying the performance issue
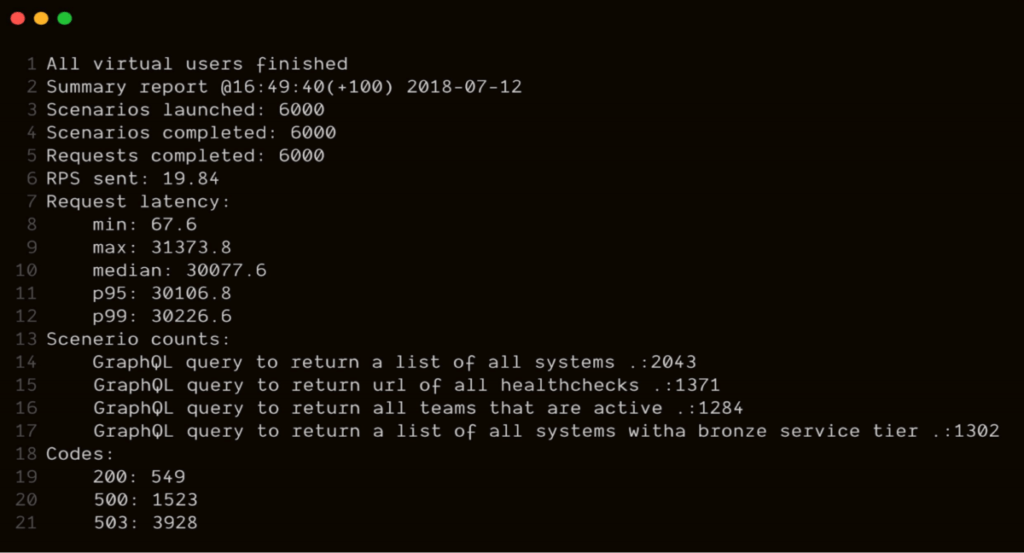
As you can see in the above report, something odd was going on. There were 1,523 500 errors (indicating an internal server error) and a whopping 3,928 503 errors (where the server was inaccessible). Also, the median request latency had grown to over 30s. This shows there was a serious performance issue.
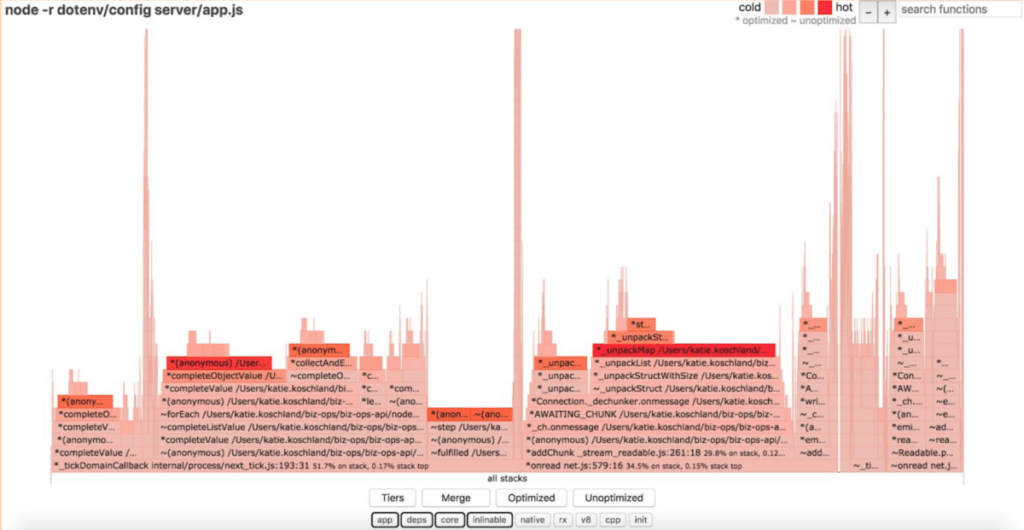
So, next Katie had to try and track down what might have caused this issue. Looking in detail one query (relating to systems with bronze service tier) was hitting 100% processor load with just 10 requests per second. But was this an application issue, or something else? Was any one call causing this query to use so much CPU? To check this, Katie used 0x to produce a flame graph which is designed to identify the hottest code paths.

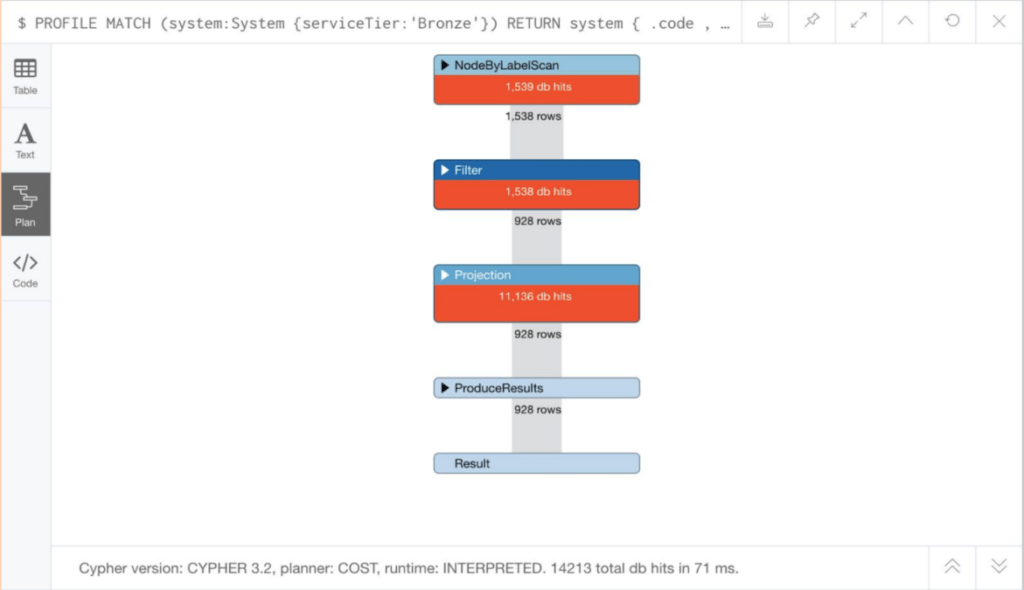
Next, she looked at the Neo4j database driver. She spotted that it was limited to a maximum of 100 connections, with any additional connection attempts timing out. She tried increasing the pool to 300 and reduced the timeout value to 10s. But this didn’t solve the issues. Then Katie looked at parameterizing the Cypher query so that queries were being reused properly. This still didn’t solve things. But maybe Cypher needed tuning? So Katie looked at the detailed performance of Cypher.

The final thought was that maybe this was down to resource starvation. So, Katie used the Node.JS calculator to work out what the ideal resource config should be. They were using shared resources with limited RAM. However, when they moved the system to dedicated resources with 4x as much RAM, the performance got WORSE!
By now you’ll all be dying to know what the fix was. Well, sadly, Katie never did manage to fix the problem. Overnight it simply went away! Suddenly, the systems all ran perfectly, coping well with the offered load.
So why use this example?
Katie told us she had shared this particular example because it had taught her a lot. She now has a personal toolbox of skills and knowledge related to load testing. Furthermore, she had been able to measure, assess and improve the performance of the application. In so doing, she had identified that there was a potential for future issues which the team can now keep an eye on.


